In SmartTutor 360, you can insert many kinds of data charts and graphs, such as column charts, line graphs, pie charts, bar charts, area graphs, scatter graphs, stock charts, surface charts, doughnut charts, bubble graphs, and radar graphs.
1. To create a simple chart from scratch in SmartTutor 360, click Insert > Chart, and pick the chart you want.
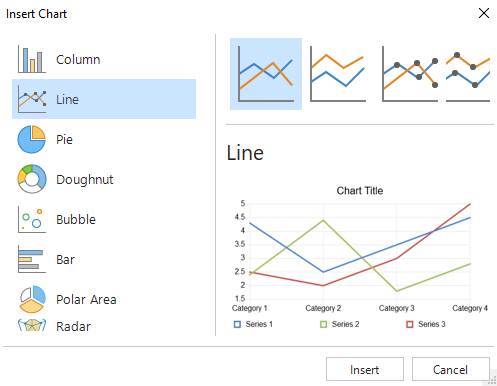
2. Click the chart type and then click Insert the chart you want.
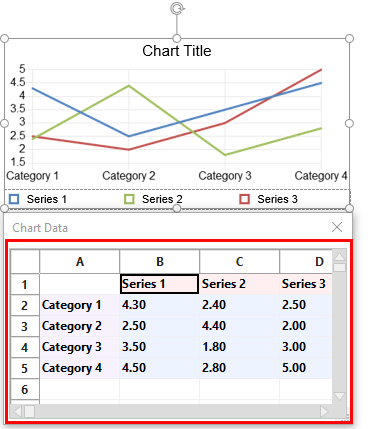
3. In the spreadsheet that appears, replace the default data with your own information.
Tips: When you insert a chart, small buttons appear next to its upper-left corner. Use the Chart Elements  button to show, hide, or format things like axis titles or data labels. button to show, hide, or format things like axis titles or data labels. |
4. When you’ve finished, close the spreadsheet.